How Do I View The Database Utilization Report?
The Database Utilization Report provides statistics on the database usage. It shows how many examinations have been conducted for the given time period. It has been designed for the purpose of being able to gauge how much traffic the system is handling and who is generating most of this traffic.
To view the Database Utilization Report:
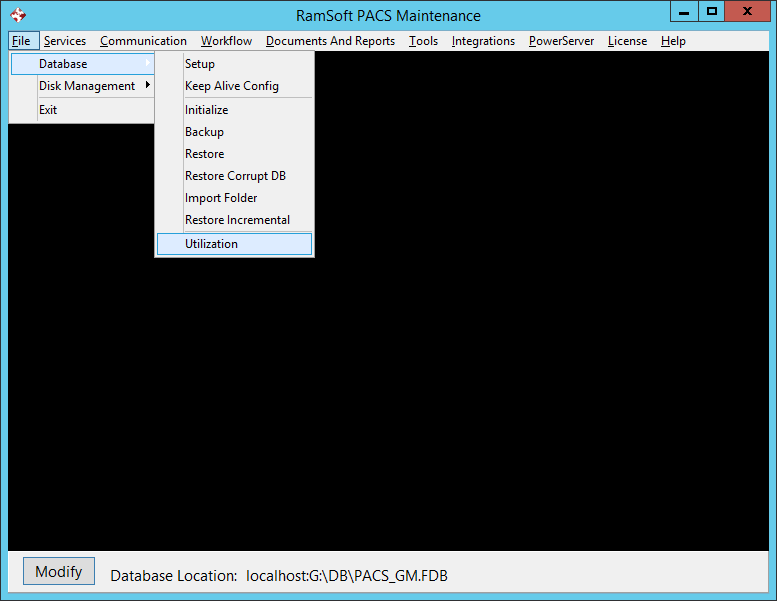
- Select the File > Database > Utilization option.
-
This will open the System Utilization form.
-
Select the desired date range as the report will show all the studies that were conducted during the requested date range (by default, a one year date range is auto-filled).

-
You can also select a specific modality or a facility click and then click on Search.
-
You can also select to expand or collapse the view, print the report or export the file. The files can be exported in MS Excel, Text, HTML or XML format.
-
Clicking the Close button will close the form.
The report lists all the studies that were conducted between the selected dates:
-
A Grand Total is generated for the whole database and is visible at the top of the report.
-
The studies are first separated by modality.
-
Each modality section is further broken down by Institution the exam was performed at.
-
Each study entry shows the date and time the study was conducted, as well as how many objects the study is composed of. Objects can be images, dictations, presentation states or reports.
-
Totals are generated for each institution.
-
Totals are also generated for each modality.