Essence - Analysis Reports
Based on the role and access privileges, users can either view a report or create a customized report. If Create Essence role is enabled for your user profile, you can Save/Write a report into your own folder - /home/{your username}.
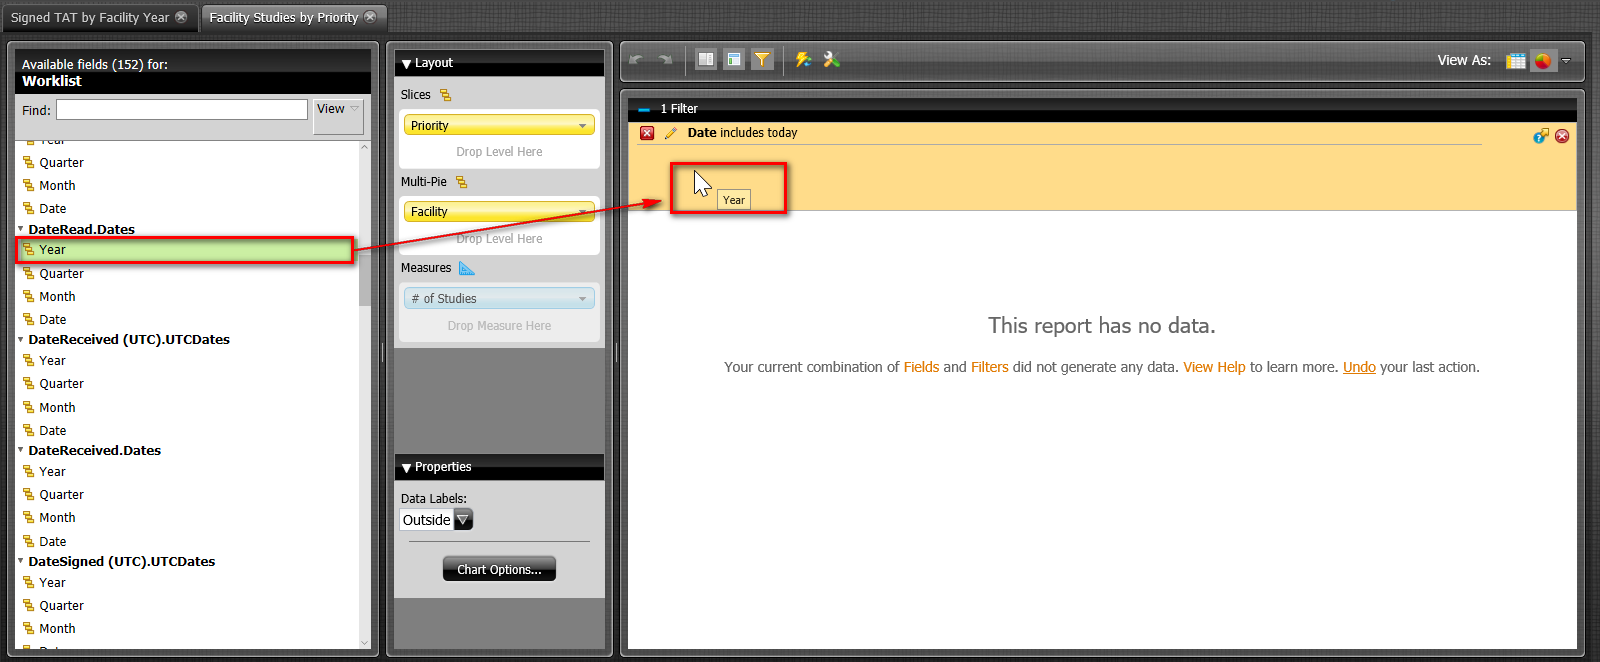
Reports with "year" in the report name (i.e. the Signed TAT by Facility Year report) has a Year filter contained by default, and can be used to filter results by year (i.e. Current Year, Previous Year, Next Year, X Years ago). For querying large amounts of data, users may apply the Date filter for under 1 months of data, the Month filter for data up to 3 months, the Quarter filter for data up to 1 year, and the Year filter for one or multiple years. These filters can be added to the report as desired by dragging the desired field to the filter section (below):
The following table lists the pre-defined reports that you can use for your analysis. Cancelled and deleted studies are included in the reports unless otherwise specified.
| Report Name | Input Description | Output Description |
|---|---|---|
| Charges by Date Read | The Issuer, Imaging Facility, Insurance Company, Modality, Procedure Code, Modifier and Procedure Description are added to the Rows by default. | This report measures the Quantity, Charge Amount, RVU Technical and RVU Professional, sortable by Issuer, Imaging Facility, Insurance Company, Modality, Procedure Code, Modifier and Procedure Description. The filter Date Read (includes today) is added by default. |
| Charges by Reading Physician | The Reading Physician, Issuer, Imaging Facility, Insurance Company, Modality, Procedure Code, Modifier and Procedure Description are added to the Columns by default. | This report displays the Total Charges for each Reading Physician and the Quantity, Charge Amount, RVU Technical and RVU Professional subtotal figures for the Imaging Facility and Issuer for each Reading Physician. |
| Charges by Study Date | The Issuer, Imaging Facility, Insurance Company, Modality, Procedure Code, Modifier and Procedure Description are added to the Rows by default. | This report displays the Quantity, Charge Amount, RVU Technical and RVU Professional sortable by the Issuer, Imaging Facility, Insurance Company, Modality, Procedure Code, Modifier and Procedure Description. The filter Date (includes today) is added by default. |
| Charges Chart by Date Read | This report contains bar charts with the Imaging Facility on the X-Axis, and each series representing a Procedure Code. Each chart represents an Issuer. | Each Issuer is displayed in Multi-Charts that measures the Charge Amount in Columns for each Procedure Code. The filter Date Read (includes today) is added by default. |
| Charges Chart by Study Date | This report contains bar charts with the Imaging Facility on the X-Axis, and each series representing a Procedure Code. Each chart represents an Issuer. | Each Issuer is displayed in Multi-Charts that measures the Charge Amount in Columns for each Procedure Code. The filter Date (includes today) is added by default. |
| Charges by Date Charge Posted | The Issuer, Imaging Facility, Insurance Company, Modality, Procedure Code, Modifier and Procedure Description are added to the rows by default. | This report displays the Quantity, Charge Amount, RVU Technical and RVU Professional, sortable by Issuer, Imaging Facility, Insurance Company, Modality, Procedure Code, Modifier and Procedure Description. The filter Date (includes today) is added by default. |
| Charges Chart by Date Charge Posted | This report contains bar charts with the Imaging Facility on the X-Axis, and each series representing a Procedure Code. Each chart represents an Issuer. | Each Issuer is displayed in Multi-Charts that measures the Charge Amount in Columns. The filter Date (includes today) is added by default. |
| Facility Studies | The Issuer, Facility fields are on the X-Axis. | The report measures the # of Studies, sortable by Issuer and Facility. The filter Date (includes today) is added by default. |
| Facility Studies by Modality | This report contains multicharts with each series representing a Modality. Each chart represents a Facility. | Each Facility is displayed in Multi-Charts that measures the # of Studies, with each series representing a Modality. The filter Date (includes today) is added by default. |
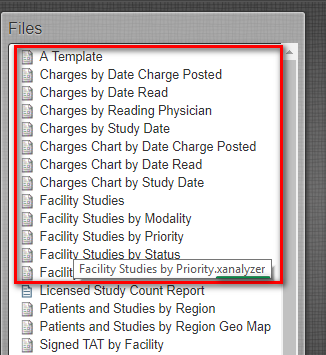
| Facility Studies by Priority | This report displays multi pie charts; each slice of the pie display a Priority. | Each Facility is displayed in Multi-Pie charts where each Slice represents a Priority and the # of Studies are measured. The filter Date (includes today) is added by default. |
| Facility Studies by Status | This report displays multi pie charts; each slice of the pie displays a Status. | Each Facility is displayed in Multi-Pie charts where each Slice represents a Status and the # of Studies are measured. The filter Date (includes today) is added by default. |
| Facility Studies Chart | This report displays multi-charts. The Facility is on the X-Axis; each series represents a Modality. | The Issuer is displayed in Multi-Charts that measures the # of Studies, with each series representing a Modality. The filter Date (includes today) is added by default. |
| Licensed Study Count Report | The From Date and To Date fields are selected by default starting from a year from the day you are generating this report. | This report provides information on the Licensed Study count for each facility. The report does not include canceled studies, deleted studies, empty studies (studies with no objects) and studies with Study Description = "PATIENT LEVEL DOCUMENT". The Issuer is displayed, followed by the Facility and Study Count. The total Licensed Study Count is displayed at the top, beside the Date Range. By default, the report opens as a HTML page. You can always specify the Output Type by selecting the required Output Type from the drop-down menu. The following Output types are supported: * HTML (Paginated) * HTML (Single Page) Excel * Excel 2007 * Comma Separated Value * Rich-Text-Format * Text * Users using Internet Explorer(IE) 11 need to perform the following steps to render the report in PDF format: a. Click Tools b. Click Manage add-ons. c. Select Show: All add-ons. d. Enable all Adobe Acrobat Create PDF (skip if you do not see this option) e. Disable Adobe PDF Reader f. Save the changes. g. Restart IE. h. Run Essence. The report would be rendered in a PDF format in a PDF Viewer not embedded in IE. |
| Patients and Studies by Region | The Country, State and City are added to the Rows; the Year is added to the columns. | The report measures the # of Patients and # of Studies for each Year, sortable by Country, State and City. The filter Year (includes current Year) is added by default. |
| Patients and Studies by Region Geo Map | Displays the # of Patients and # of Studies on a map with Country, State and City | The map displays the # of Patients, color coded by the # of patients, with the sizes of the highlighted areas representing the # of Studies. The filter Year (includes current Year) is added by default. |
| Signed TAT by Facility | The Issuer and Facility are added to the rows by default. | The report measures the # of Studies and the Signed TAT (turn around time) from Received (avg, hrs). The filter Date (includes today) is added by default. |
| Signed TAT by Facility Year | Same as the Signed TAT by Facility report but with a Year filter. | This report can be used in place of the Signed TAT by Facility report if the reporting period is large (i.e. several years, or for a specific year). The filter Year (includes current Year) is added by default. |
| Signed TAT by Reading Physician | The Issuer and Reading Physician fields are added by default in the Rows section. | The report measures the # of Studies and the Signed TAT (turn around time) from Read (avg, hrs). The filter Date (includes today) is added by default. |
| Signed TAT by Reading Physician Year | Same as Signed TAT by Reading Physician with a Year filter. | This report can be used in place of the Signed TAT by Reading Physician report if the reporting period is large (i.e. several years, or for a specific year). The filter Year (includes current Year) is added by default. |
| Signed TAT Chart by Facility | The Facility is on the X-Axis. This report contains Multi-Charts. | Each issuer is displayed in Multi-Charts that measures the Signed TAT (turn around time) from Read (avg, hrs). The filter Date (includes today) is added by default. |
| Signed TAT Chart by Facility Year | Same as the Signed TAT Chart by Facility report but with a Year filter. | This report can be used in place of the Signed TAT Chart by Facility report if the reporting period is large (i.e. several years, or for a specific year). The filter Year (includes current Year) is added by default. |
| Signed TAT Chart by Reading Physician | The Reading Physician is on the X-Axis. This report contains Multi-Charts with each chart representing an Issuer. | Each issuer is displayed in Multi-Charts that measures the Signed TAT (turn around time) from Read (avg, hrs). The filter Date (includes today) is added by default. |
| Signed TAT Chart by Reading Physician Year | Same as Signed TAT Chart by Reading Physician with a Year filter. | This report can be used in place of the Signed TAT Chart by Reading Physician report if the reporting period is large (i.e. several years, or for a specific year). The filter Year (includes current Year) is added by default. |
| Status Transition Time by Facility | The Issuer, Facility and From Status is added by default to the rows; the To Status is added to the Columns. | This report provides information on the Transition time (in hours) for a study status to change from each "From Status" to each "To Status". The filter Date (includes today) is added by default. |
| Status Transition Time by Reading Physician | The Issuer, Reading Physician, From Status fields in the Rows section and To Status field in the Columns section are added by default. | This report measures the Transition Hours from each "From Status" to each "To Status", sortable by Issuer, Reading Physician and From Status. The filter Date (includes today) is added by default. |
| Status Transition Time by Modality | The Issuer, Modality and From Status are added to the rows; the To Status is on the Columns. | This report measures the Transition Hours from each "From Status" to each "To Status", sortable by Issuer, Modality and From Status. The filter Date (includes today) is added by default. |
| Status Transition Time by Performing Physician | The Issuer, Performing Physician and From Status are added to the Rows. The To Status is on the Columns. | This report measures the Transition Hours from each "From Status" to each "To Status". The filter Date (includes today) is added by default. |
| Status Transition Time by Referring Physician | The Issuer, Referring Physician, From Status are added to the Rows. The To Status field is added to the Columns. | This report measures the Transition Hours from each "From Status" to each "To Status". The filter Date (includes Today) is added by default. |
| Status Transition Time by Study | The Issuer, Facility, Reading Physician, Accession #, From Status fields are added to the Rows. The To Status is added to the Columns. | This report measures the Transition Hours from each From Status to each To Status, sortable by Issuer, Facility, Reading Physician, Accession # and From Status. The filter Date (includes Today) is added by default. |
| Status Transition Time by Technologist | The Issuer, Technologist and From Status fields are added to the Rows. The To Status is added to the Columns. | This report displays the Transition Hours from each From Status to each To Status, sortable by Issuer, Technologist and From Status. The filter Date (includes Today) is added by default. |
| Status Transition Time by Transcriptionist | The Issuer, Transcriptionist and From Status fields are added to the Rows. The To Status is added to the Columns. | This report displays the Transition Hours from each From Status to each To Status, sortable by Issuer, Transcriptionist and From Status. The filter Date (includes Today) is added by default. |
| Studies Assigned to Reading Physician | The Reading Physician, Issuer, Facility are added to the Rows. | This report displays the # of Studies, # of Final Reports and # of Addendums sortable by Reading Physician, Issuer and Facility. |
| Studies Read by Facility | This report contains pie charts. Each pie represents an Issuer, each Slice represents a Facility. | The # of Studies are represented by the size of slices in the pie charts, with each pie representing an Issuer and each Slice representing a Facility. |
| Studies Read by Modality | This report contains pie charts. Each pie represents an Issuer, each Slice represents a Modality. | The # of Studies are represented by the size of slices in the pie charts, with each pie representing an Issuer and each Slice representing a Modality. |
| Studies Read by Reading Physician | The Reading Physician, Issuer and Facility are added to the Rows by default. | This report display the # of Studies, # of Final Reports and # of Addendums, sortable by Reading Physician, Issuer and Facility. The filter Date (includes today) is added by default. |
| Studies Read Detailed | The Issuer, Facility and Modality are added to the Rows by default. | This report displays the # of Studies, # of Dictations, # of Diagnostic Reports, # of Final, # of Addendums, sortable by Issuer, Facility, Modality. The filter Date (includes today) is added by default. |
| Studies Read Hourly | This report displays a line chart. The Hour is displayed on the X-Axis. The # of Studies are measured on the Y-Axis. Each series represents an issuer. | This report displays the # of Studies for each Hour for each Issuer on a line graph. The filter Date (today) is added by default. |
| Studies Read Hourly by Reading Physician | This report displays line charts. The Hour is displayed on the X-Axis. The # of Studies are measured on the Y-Axis. Each chart represents a Reading Physician. | This report displays the # of Studies for each Hour in Multi-Charts, with each Chart representing a Reading Physician. The filter Date (today) is added by default. |
| Studies Referred by Referring Physician | The Referring Physician, Issuer and Facility are added to the Rows. | This report displays the # of Studies, # of Final Reports and # of Addendums sortable by Referring Physician, Issuer and Facility. The filter Date (today) is added by default. |
| Studies Statistics | The Issuer and Facility are added to the Rows. | This report displays the # of Studies, # of Ordered Studies, # of Received Studies, # of Verified Studies, # of Read Studies, # of Transcribed Studies, # of Signed Studies and # of Amended Studies, sortable by Issuer and Facility. The filter Date (today) is added by default. |
| Studies Statistics Year | The same as the Studies Statistics report with a Year filter. | This report can be used in place of the Studies Statistics report if the reporting period is large (i.e. several years, or for a specific year). The filter Year (includes current Year) is added by default. |
| Studies Verified by Technologist | The Technologist, Issuer and Facility are added to the Rows. | This report displays the # of Studies, # of Final and # of Addendums, sortable by Technologist, Issuer and Facility. The filter Date (includes today) is added by default, as well as the filter Status (includes AMENDED SIGNED, DICTATED, PRIOR, SIGNED, TO BE AMENDED, TRANSCRIBED and VERIFIED). |
| Studies Statistics Chart | This is a multi chart with each chart representing an Issuer. | This report provides key statistics on Studies throughout their life cycle in the Chart format. Each issuer is displayed as a chart. You can find the following information on Studies for each Issuer: * # of Studies * # of Ordered Studies * # of Received Studies * # of Verified Studies * # of Read Studies * # of Transcribed Studies * # of Signed Studies * # of Amended Studies The filter Date (includes today) is added by default. |
| Studies Statistics Chart Year | Same as Studies Statistics Chart but with a year filter. | This report can be used in place of the Studies Statistics Chart report if the reporting period is large (i.e. several years, or for a specific year). The filter Year (includes current Year) is added by default. |
| Top 100 Referring Physicians | The Referring Physician is added to the Rows by default. | This report displays the # of Studies sorted by Referring Physician with the filter Date (includes today) added by default for the Top 100 Referring Physicians by # of Studies. |
| Top 3 Referring Physicians per Modality | The Modality and Referring Physician fields are added to the Rows by default. | This report displays the # of Studies sorted by Modality and Referring Physician with the filter Date (includes today), as well as the filter Top 3 (Referring Physician by # of Studies). |
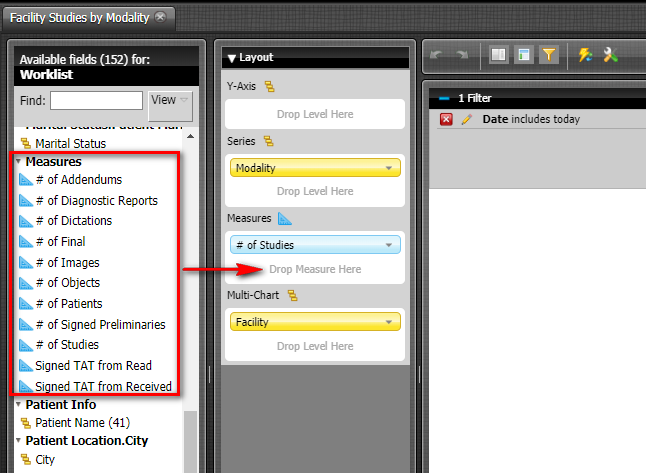
Analysis Reports that are of file type .xanalyzer allows users to customize measurements such as the # of Studies, as well as other report outcome parameters such as what is being displayed on the X (Series) and Y Axis.
By default, the Measures field for these Analysis reports measures the # of studies. To add more fields, drag and drop parameters from the Measures section in Available fields for Worklist to the Measures section in Layout.
To customize how the totals are calculated for the # of Studies field, right-click the "# of Studies" and click Subtotals.
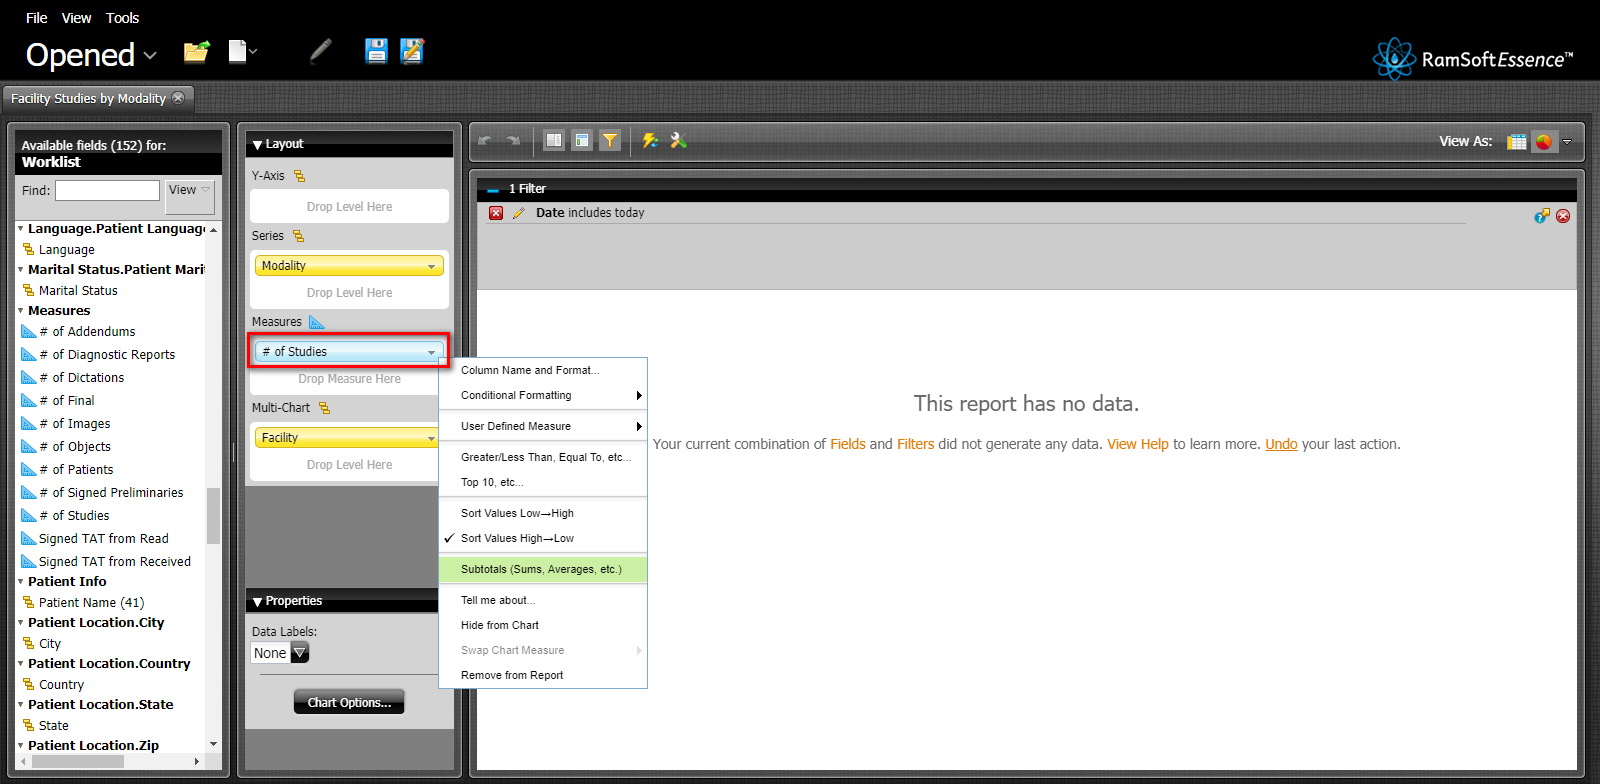
The default and recommended measurement method for totals is Aggregate as this works best with the RamSoft analytics architecture. Users can modify the types of totals displayed by checking the respective boxes as shown below.
