Region Of Interest
The Region of Interest (ROI) ![]() tools from the Annotation Tools toolbar are used to draw a region of interest on the image. The information about the region's size and pixel intensity distribution is displayed beside it. The only difference between the tools is the shape they are used to draw.
tools from the Annotation Tools toolbar are used to draw a region of interest on the image. The information about the region's size and pixel intensity distribution is displayed beside it. The only difference between the tools is the shape they are used to draw.

The four ROI tools are accessible by clicking the ROI pull-down menu. The tool that was last used is the one that will be activated when the ROI tool is pressed, and will also be the icon that will be visible in the toolbar.
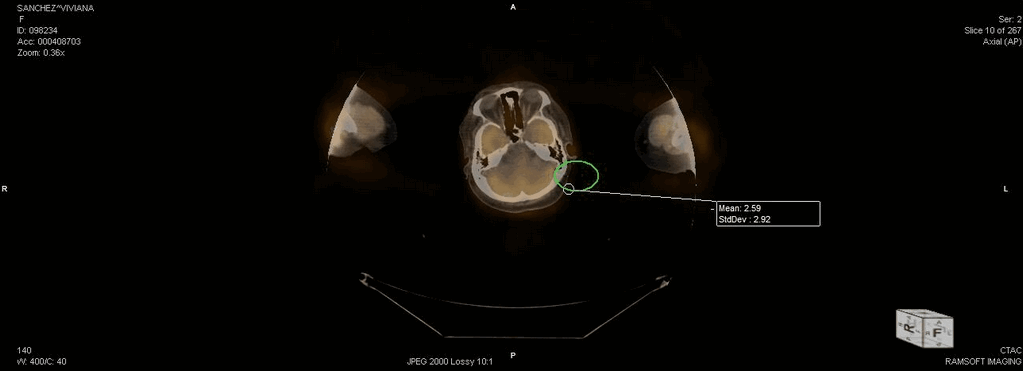
The Ellipse ROI tool. This tool is used to draw an oval/circular ROI which should embrace the ROI.
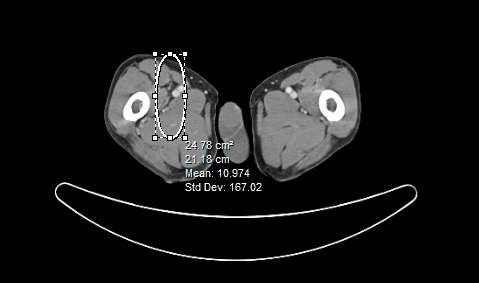
The Rect (Rectangle) ROI and Ellipse ROI tools are drawn by clicking on the image and dragging the shape. Once the desired area is enclosed in the ROI, the mouse button can be released.
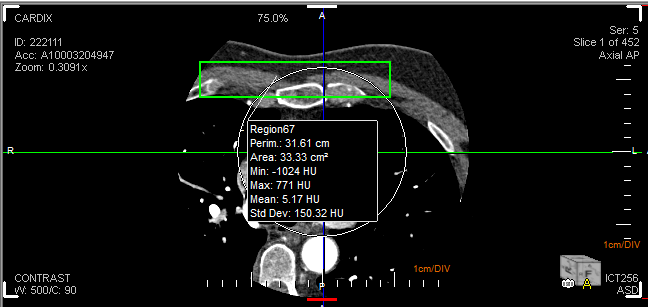
The Circle ROI tool is drawn by placing three points on the image. These are all points located on the perimeter of the circle.
The FreeHand ROI is used by holding down the mouse button and drawing on the image by free hand. Once the mouse button is released, the beginning and ending points of the region are linked by a straight line in order to close off the region. The following image contains one of each of the four possible ROI annotations.
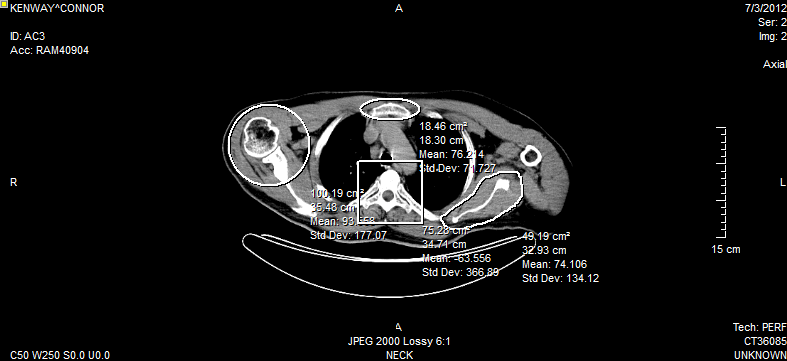
Each annotation display information on the area of the ROI and the Mean and Standard Deviation values of the pixel intensities.
The ROI right-click menu is shown.
The Show Annotations option displays the image's annotation values whenever a certain region of the image is highlighted by an ROI. These features can be toggled on or off depending on the user. This works for the Ellipse ROI, Rect ROI, Circle ROI, and Freehand ROI.
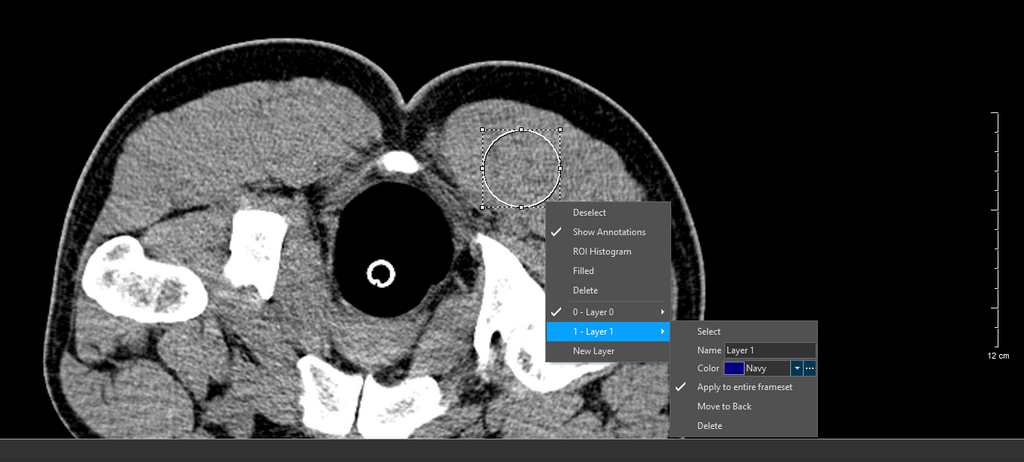
Start by highlighting an area of the image using a ROI tool. In this case, the Rect ROI is used.
After the image is highlighted, right-click to display the Annotations menu. This consists of Deselect, Show Annotations, ROI Histograms, Filled, Delete, and Layers. Any number of layers can be added. You can also choose to apply a Annotation Layer to an entire Frameset by selecting the option Apply to entire frameset. Note that this option may not be applicable for Key Objects as Key Objects may contain different framesets.
By default, the Layer 0 is selected. A Layer can be deleted by selecting the Layer and clicking the Delete option.
The option to add a new Layer is not available if the role privilege "Save Presentation States" enabled.
Click the Show Annotations option. The annotations for the highlighted area of the image are displayed. To undo these changes, right-click again, and click the Show Annotations option.
ROI measurements (excluding PET SUV measurements) are available in MPR/Fusion modes.
The ROI displays the size, density and uptake measurements in the same way as it does for a non-fusion image.
In MPR mode, the ROI statistics is not expanded by default. Users need to click the "+" sign to expand the ROI annotation and view the statistics.
The following image shows an ROI tool being applied in the MPR mode.
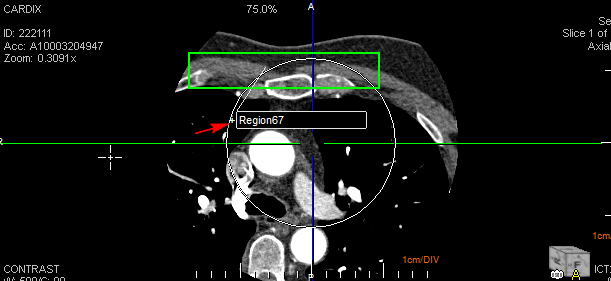
Clicking on the "+" sign expands the ROI statistics like the area of the ROI and the Mean and Standard Deviation values of the pixel intensities.
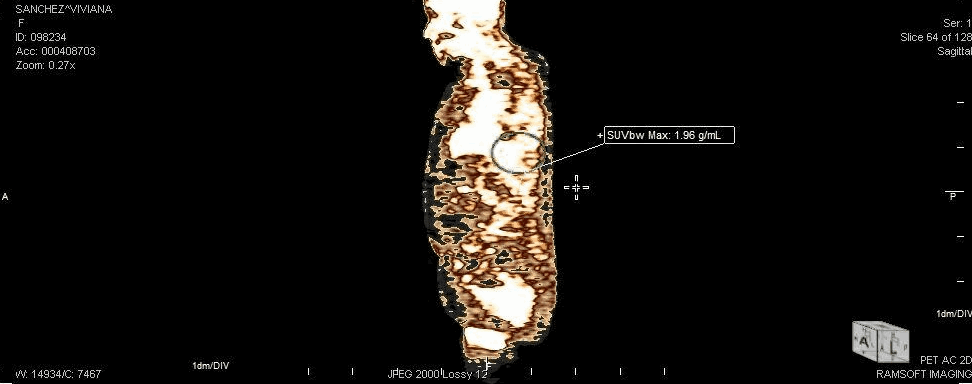
For PET images, the ROI tool will display (depending on the image) SUV Body Weight (SUVbw), SUV Lean Body Mass (SUVlbm) and SUV Body Surface Area (SUVbsa).
For CT images, the ROI tool will display the Mean and Standard Deviation of the ROI.
In MPR, when creating a ROI, path, or measurement in Straightened mode, hold down the left Ctrl key. The right Ctrl key will not draw statistics.
The ROI Histogram option will display details about the density/intensity of the pixels within the ROI. This feature is described in more detail in the How Do I View Density Information? section.
The Filled option will fill the ROI with a solid color. The Delete option will delete the ROI.