Navigating the Study Desktop
Interaction with the Study Desktop is performed using the mouse. The activation of any tool in the toolbar is carried out by clicking the tool once with the mouse button. When a tool has been activated, it appears as a pressed-in button. The mouse cursor icon also changes to indicate that it is now a specific tool.
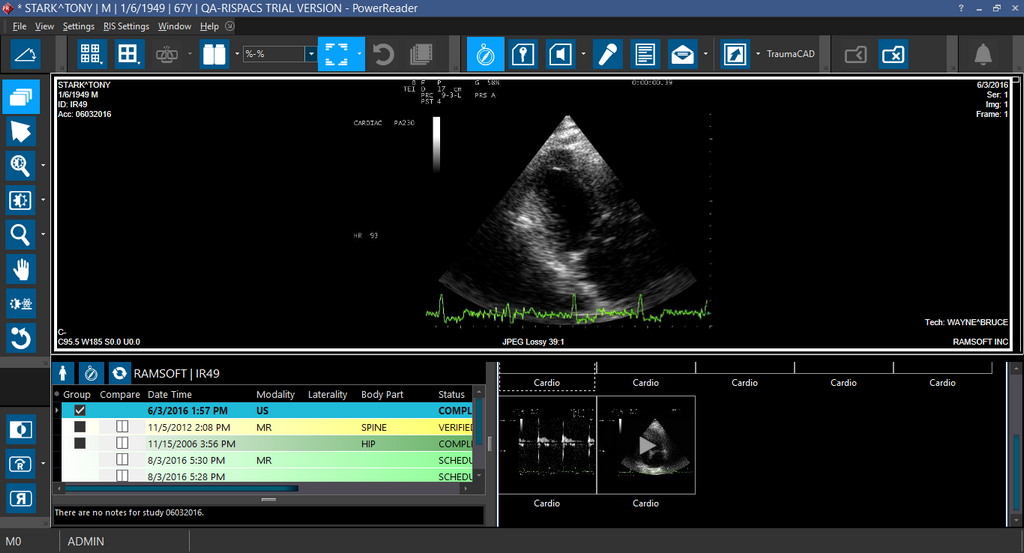
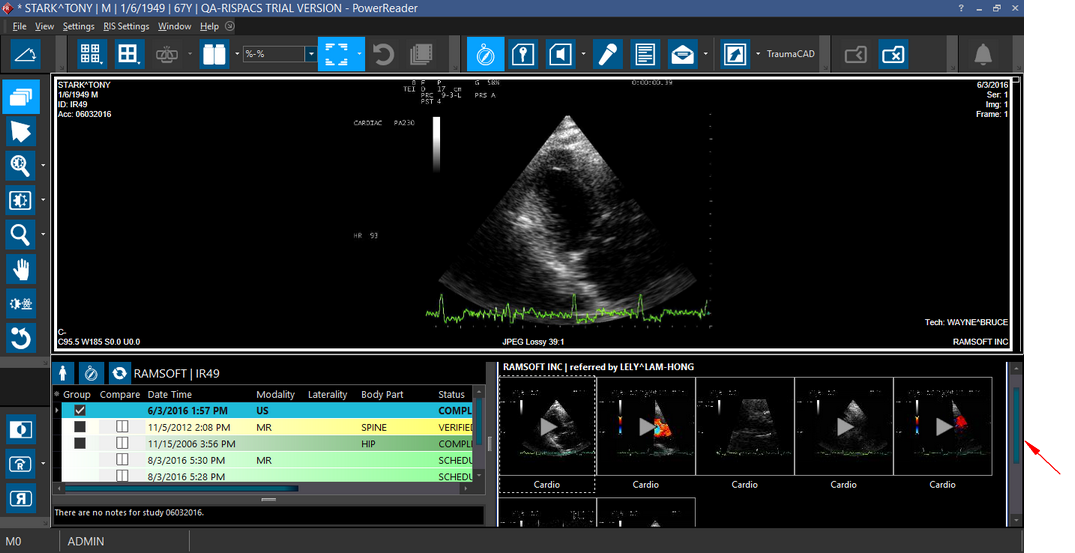
In the image above, the Zoom tool ![]() has been activated. This is indicated by the highlighted Zoom tool as well as a magnifying glass mouse cursor.
has been activated. This is indicated by the highlighted Zoom tool as well as a magnifying glass mouse cursor.
The Study Desktop can be categorized into three areas, explained below:
- Study Desktop Toolbar
- Image Viewer
- Patient Explorer
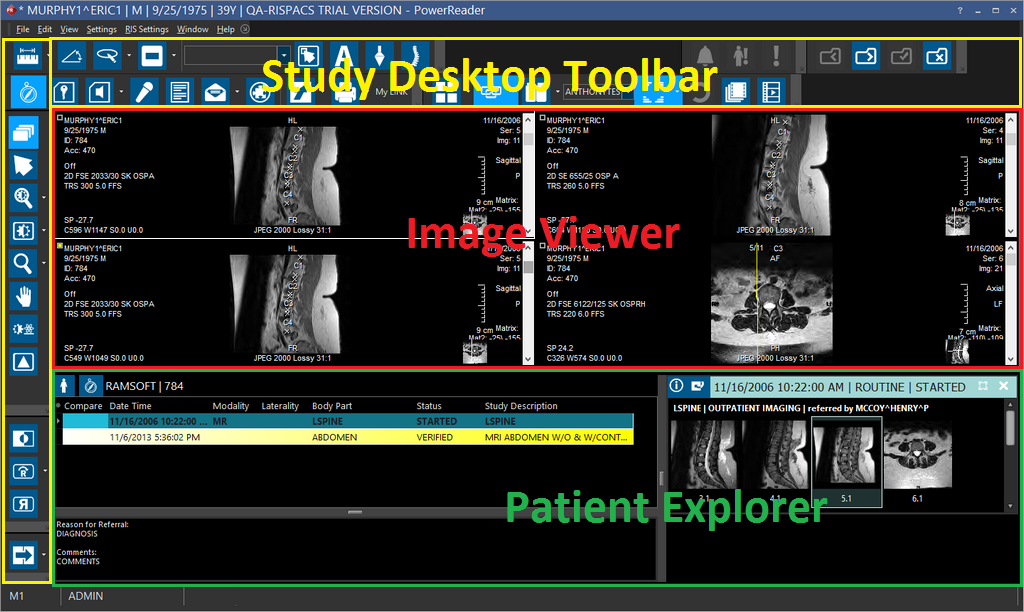
Study Desktop Toolbar
Tools can also be activated with a keyboard shortcut. By default, the Zoom tool can be activated by pressing Shift + F7. A complete list of all the shortcut keys can be found in the Shortcut Keys section of the manual.
A tool can be deactivated by either selecting another tool, clicking on the currently active tool to turn it off, or by clicking on the default pointer tool. This tool has the same appearance as the Windows mouse pointer.
The layout of the toolbar can be customized. Some tools can be hidden or moved around to accommodate each user. The Customizing My Tools section explains this feature.
![]()
![]()
When scrolling over studies, if the mouse is hovered over a series that is different from the current selected series and scrolling is performed, the Document Viewer will automatically scroll to the Reports/Documents tab. Note that just hovering the mouse over a prior study's series does not have any effect on the Document Viewer documents tabs.
When scrolling over studies, if you hover the mouse over the active series of the current study and start scrolling, there would not be any corresponding change in the Document Viewer documents tabs display.
Sorting Axial, Coronal and Sagittal images happens as follows in PowerReader for all Modalities (except MG):
- MR Sagittal images are sorted from Left (L) to Right (R).
- MR Coronal images are sorted from Posterior (P) to Anterior (A).
- MR Axial images are sorted from Head (H) to Feet (F).
Sorting Oblique plane type slices is not supported in PowerReader.
Image Viewer
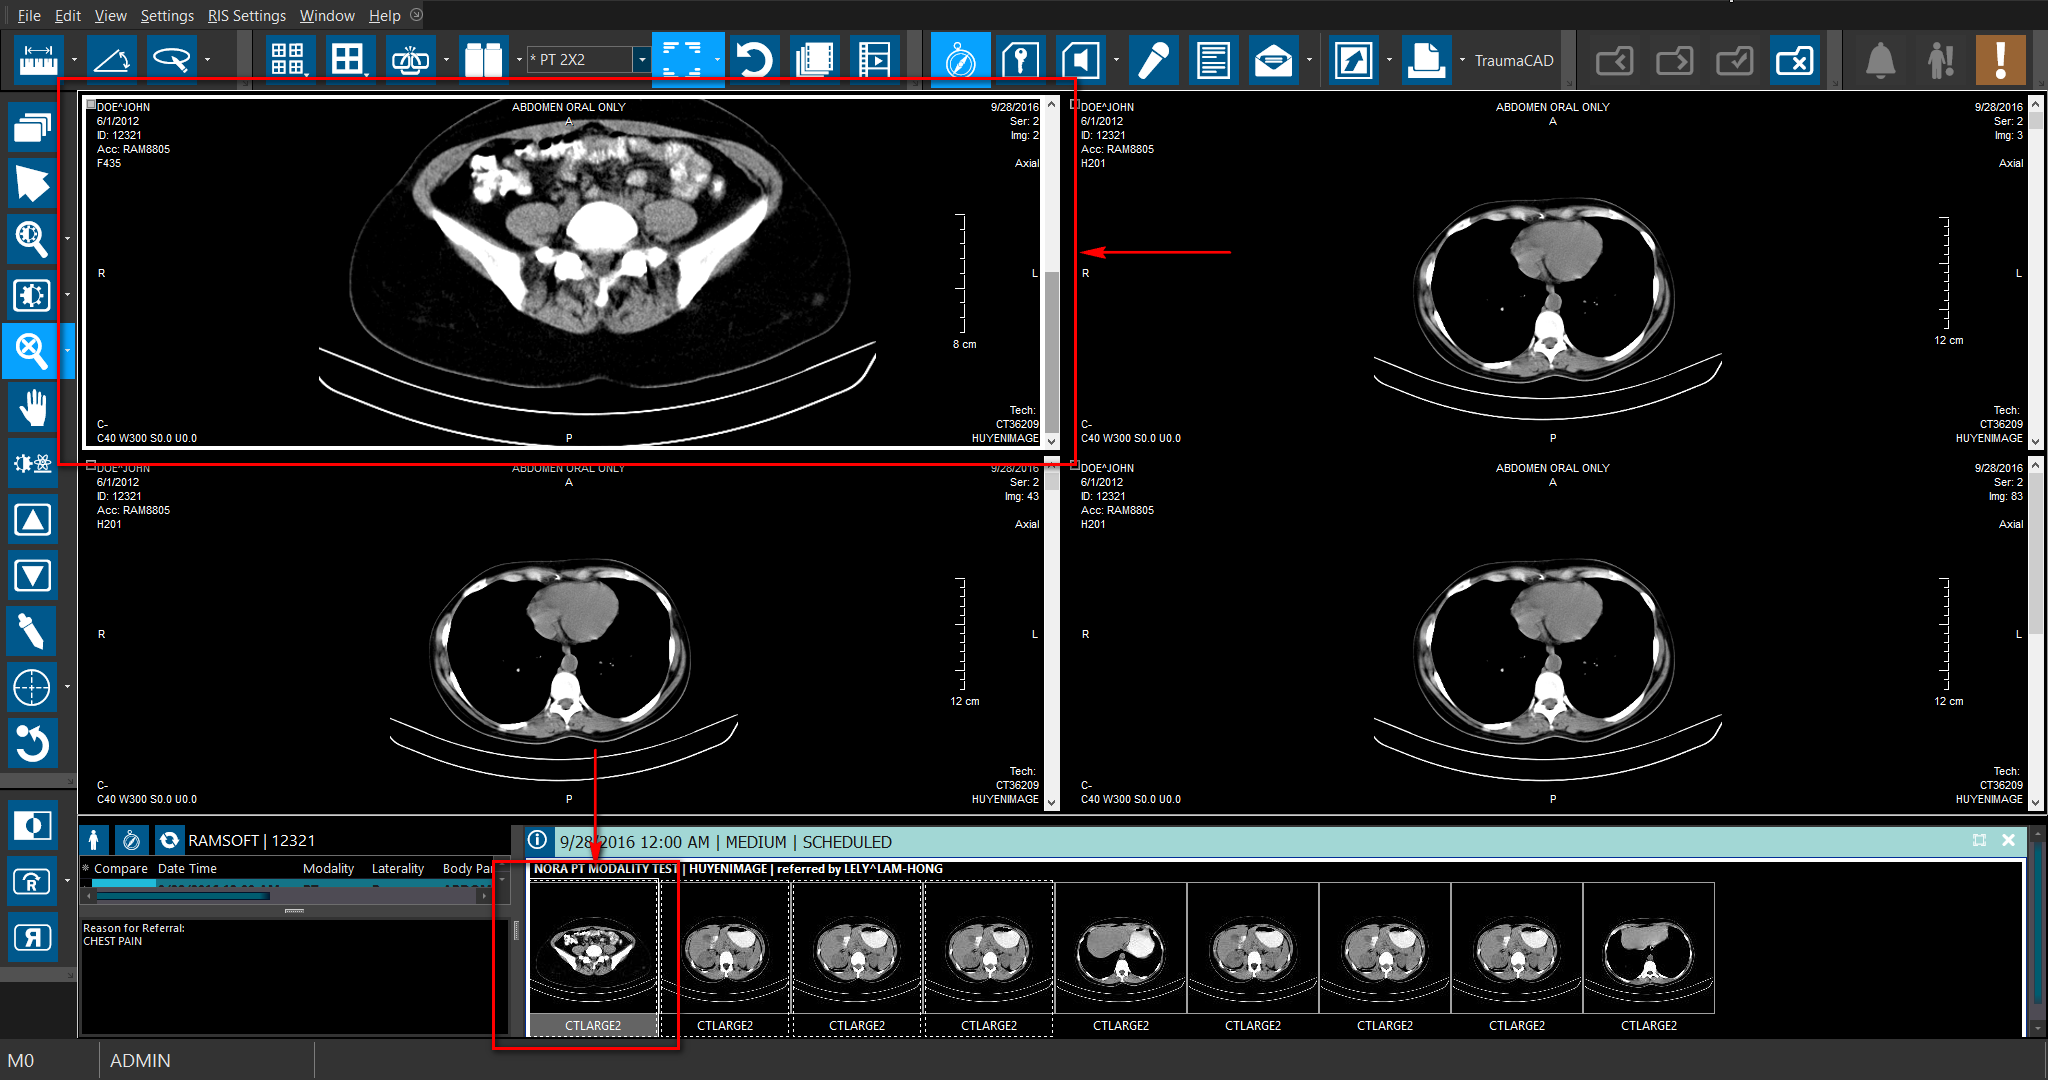
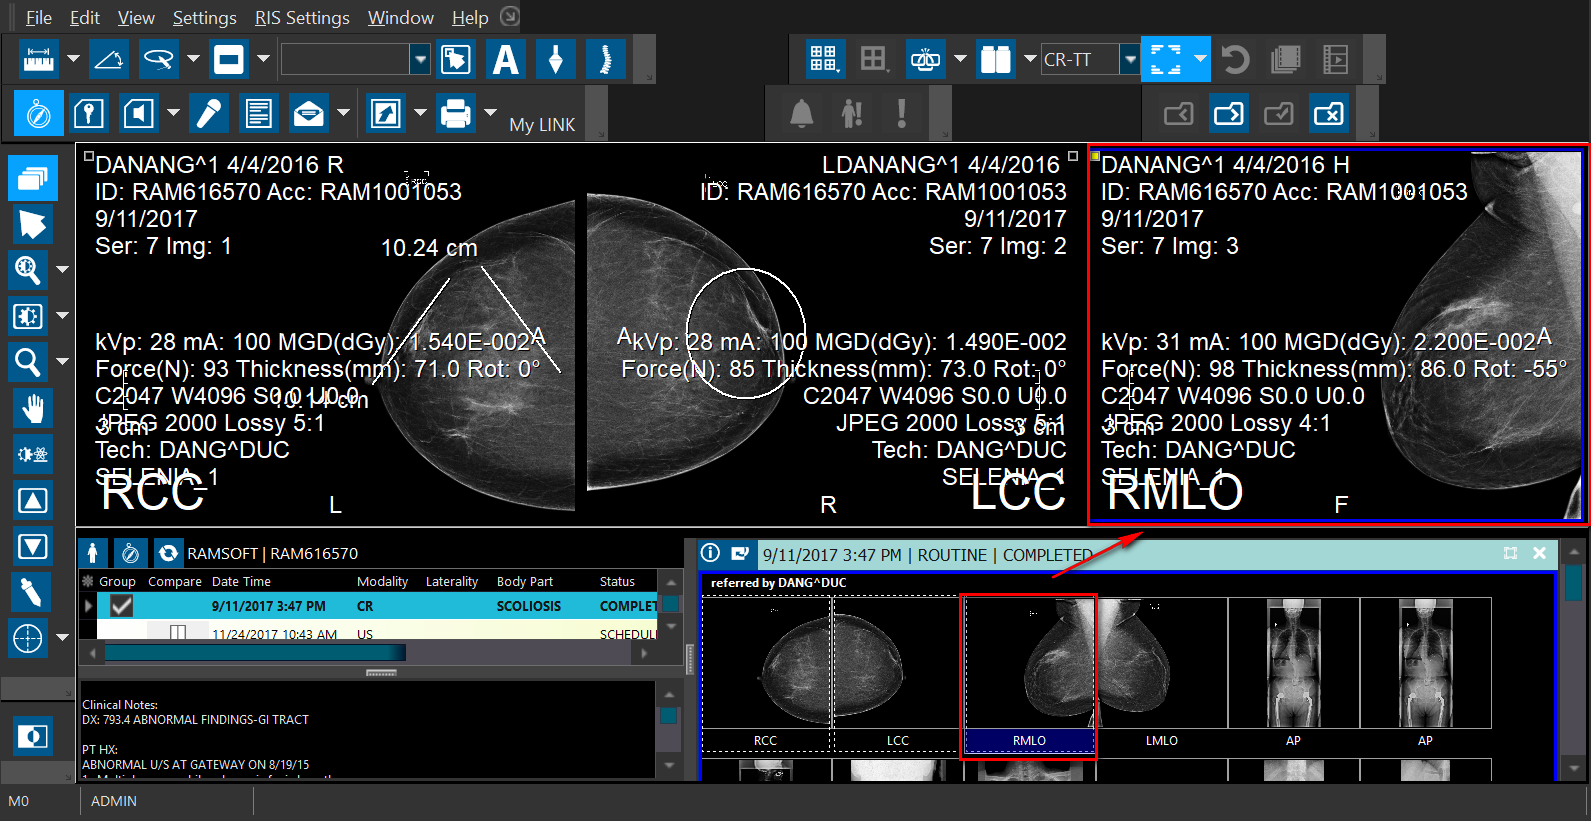
The Image Display Area is composed of viewports. A viewport is used to hold one series of images. The number of images visible in a viewport can be varied, however, they all have to belong to the same series of images. The number of viewports visible on the screen can also be varied. In the following screenshot, there are four viewports, each displaying different images. When the viewport is selected, it becomes the Active Viewport indicated by a thick white border. The thumbnail series specific to the image in the viewport is highlighted with a dotted line in the Patient Explorer. Furthermore, as the user scrolls through other framesets (series) the Patient Explorer auto-scrolls to that specific thumbnail series.
Users can import and view the following image formats in the Image Viewer: PNG, GIF, ICO, EMO and WMF.
Once you understand the navigating basics, you need to know how to change what is currently being displayed on the screen, as well as how to modify the screen layout. The image viewports can be swapped around by left clicking on any image within a viewport and dragging that whole viewport to the desired location. To load a new series into the current viewport, right click within that viewport to open the Image Right Click Menu.
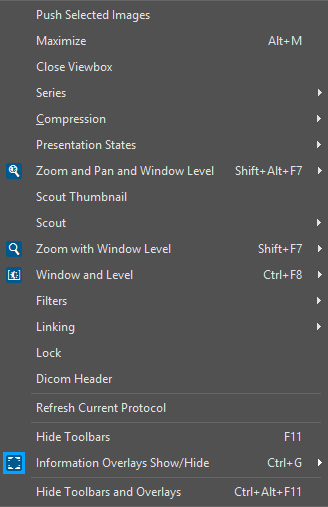
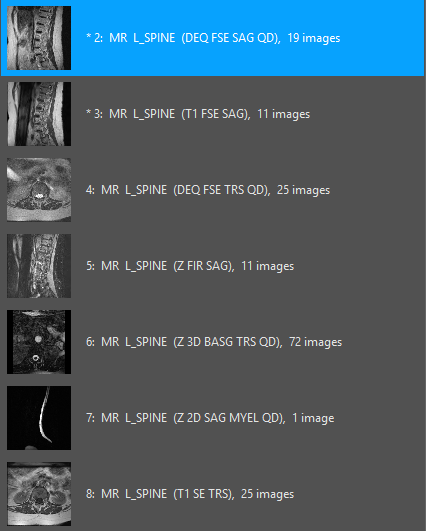
Image thumbnails automatically switch to series thumbnails when the number of images surpasses the max value of images thumbnails allowed. This is configurable by administrative users within System Configuration under the entry "Max Number of Series Images Allowed to have Image Thumbnails". The default value for the entry is 50.
When a series has still images together with multi-frame images, all still images are combined into one frameset and multi frame images are displayed in their own frame sets. This is useful when users have to access the CINE images without having to scroll through large number of images.
Aside from loading the series displayed on the screen, you can also decide the layout of viewports and images. This is done by using the Setup Layout Multiple Viewports ![]() icon found in the toolbar.
icon found in the toolbar.
In the grid, you can choose the number of viewports that should be visible on the screen. In the Setup Layout Within Viewport grid, you can choose how many images are visible at once in the viewport and how they are laid out.
For information on the fusing monitors, see How Do I Edit a Viewing Protocol?
The layout adjustments described above are only temporary. As soon as the current study is closed, they will be lost. To make them permanent, you can save them as a Viewing protocol.
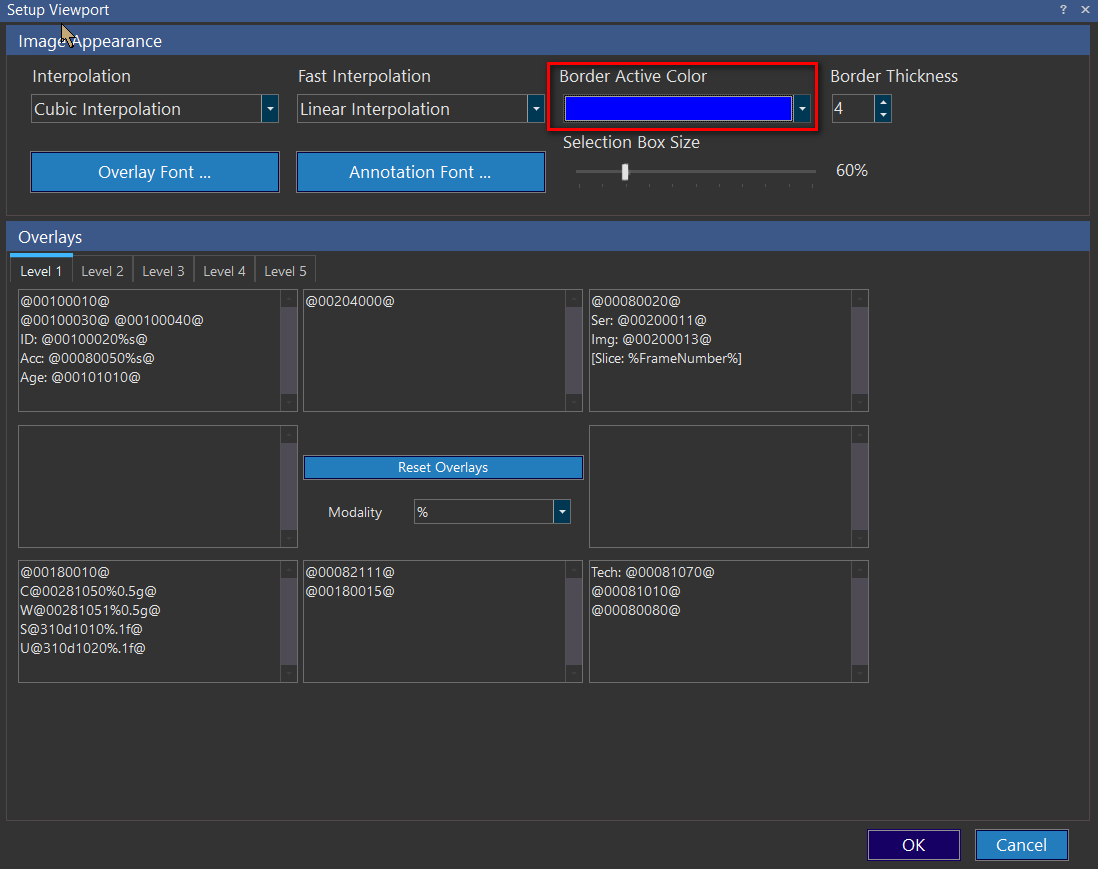
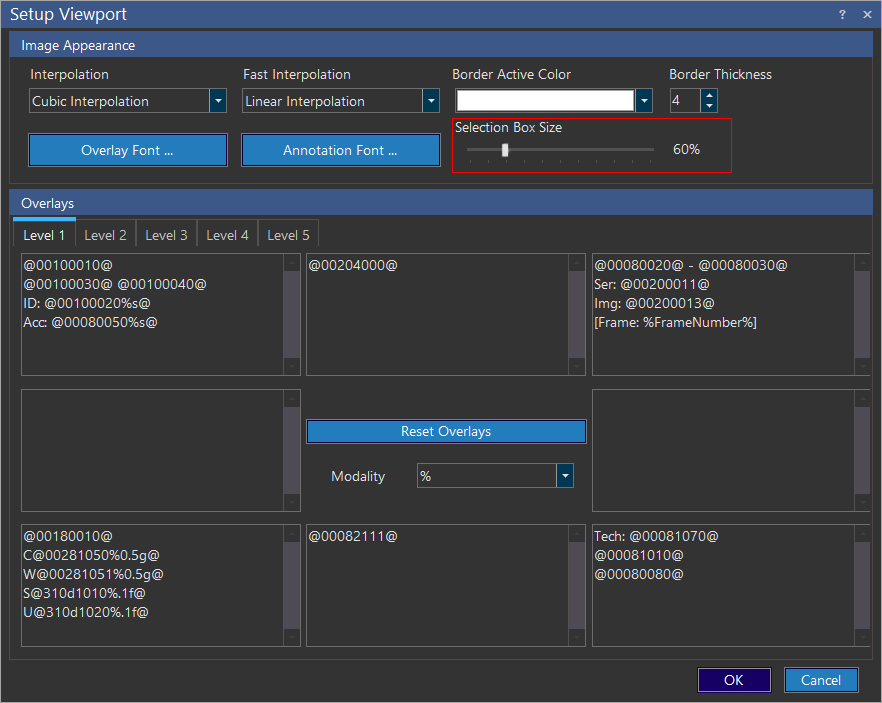
Border Active Color
The color of the viewport border can be personalized by going into View > Setup Viewport. In the Setup Viewport window, choose the desired Border Active Color and then go to the Setup Display window and make sure that the Grayscale checkbox is not selected for any monitor.
If the user changes the viewport border color when a monitor color is set to Grayscale, the following warning message appears:

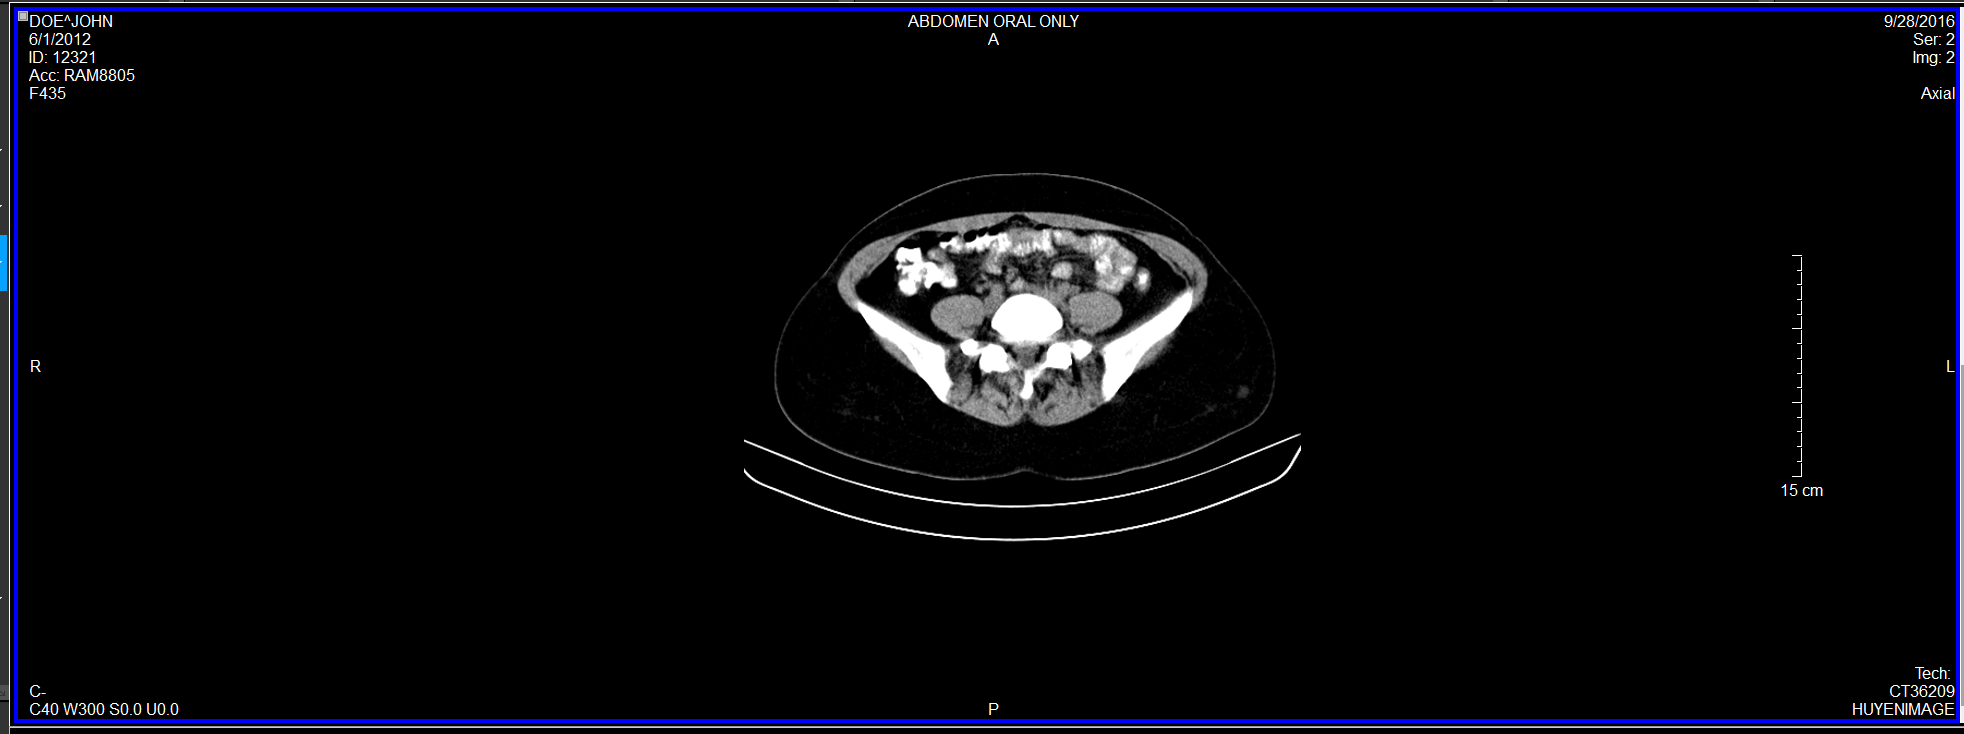
This is what the viewport will look like if the color of the border has been selected.
Border Thickness
The Border Thickness field lets you set the Border Thickness for a Viewport border. By default, the Border Thickness value is set at 4. You can set this value between 1 - 10.
Selection Box Size
The size of the Image selection box can now be configured using the Selection Box Size slider control in View > Setup Viewport.
By default, the image selection box size is set at 60%. You can configure this from a size ranging from 50% to 100%.
Patient Explorer
Patient Explorer lets you display multiple thumbnails for many studies without loading actual images belonging to the studies. Patient Explorer also gives you quick access to a StudyGrid displaying the study list and other linked studies belonging to the patient. You can also access comparison study documents both from the StudyGrid and thumbnails section.
You can view multiple studies from on the patient explorer without having to open multiple windows and alternate between different studies.
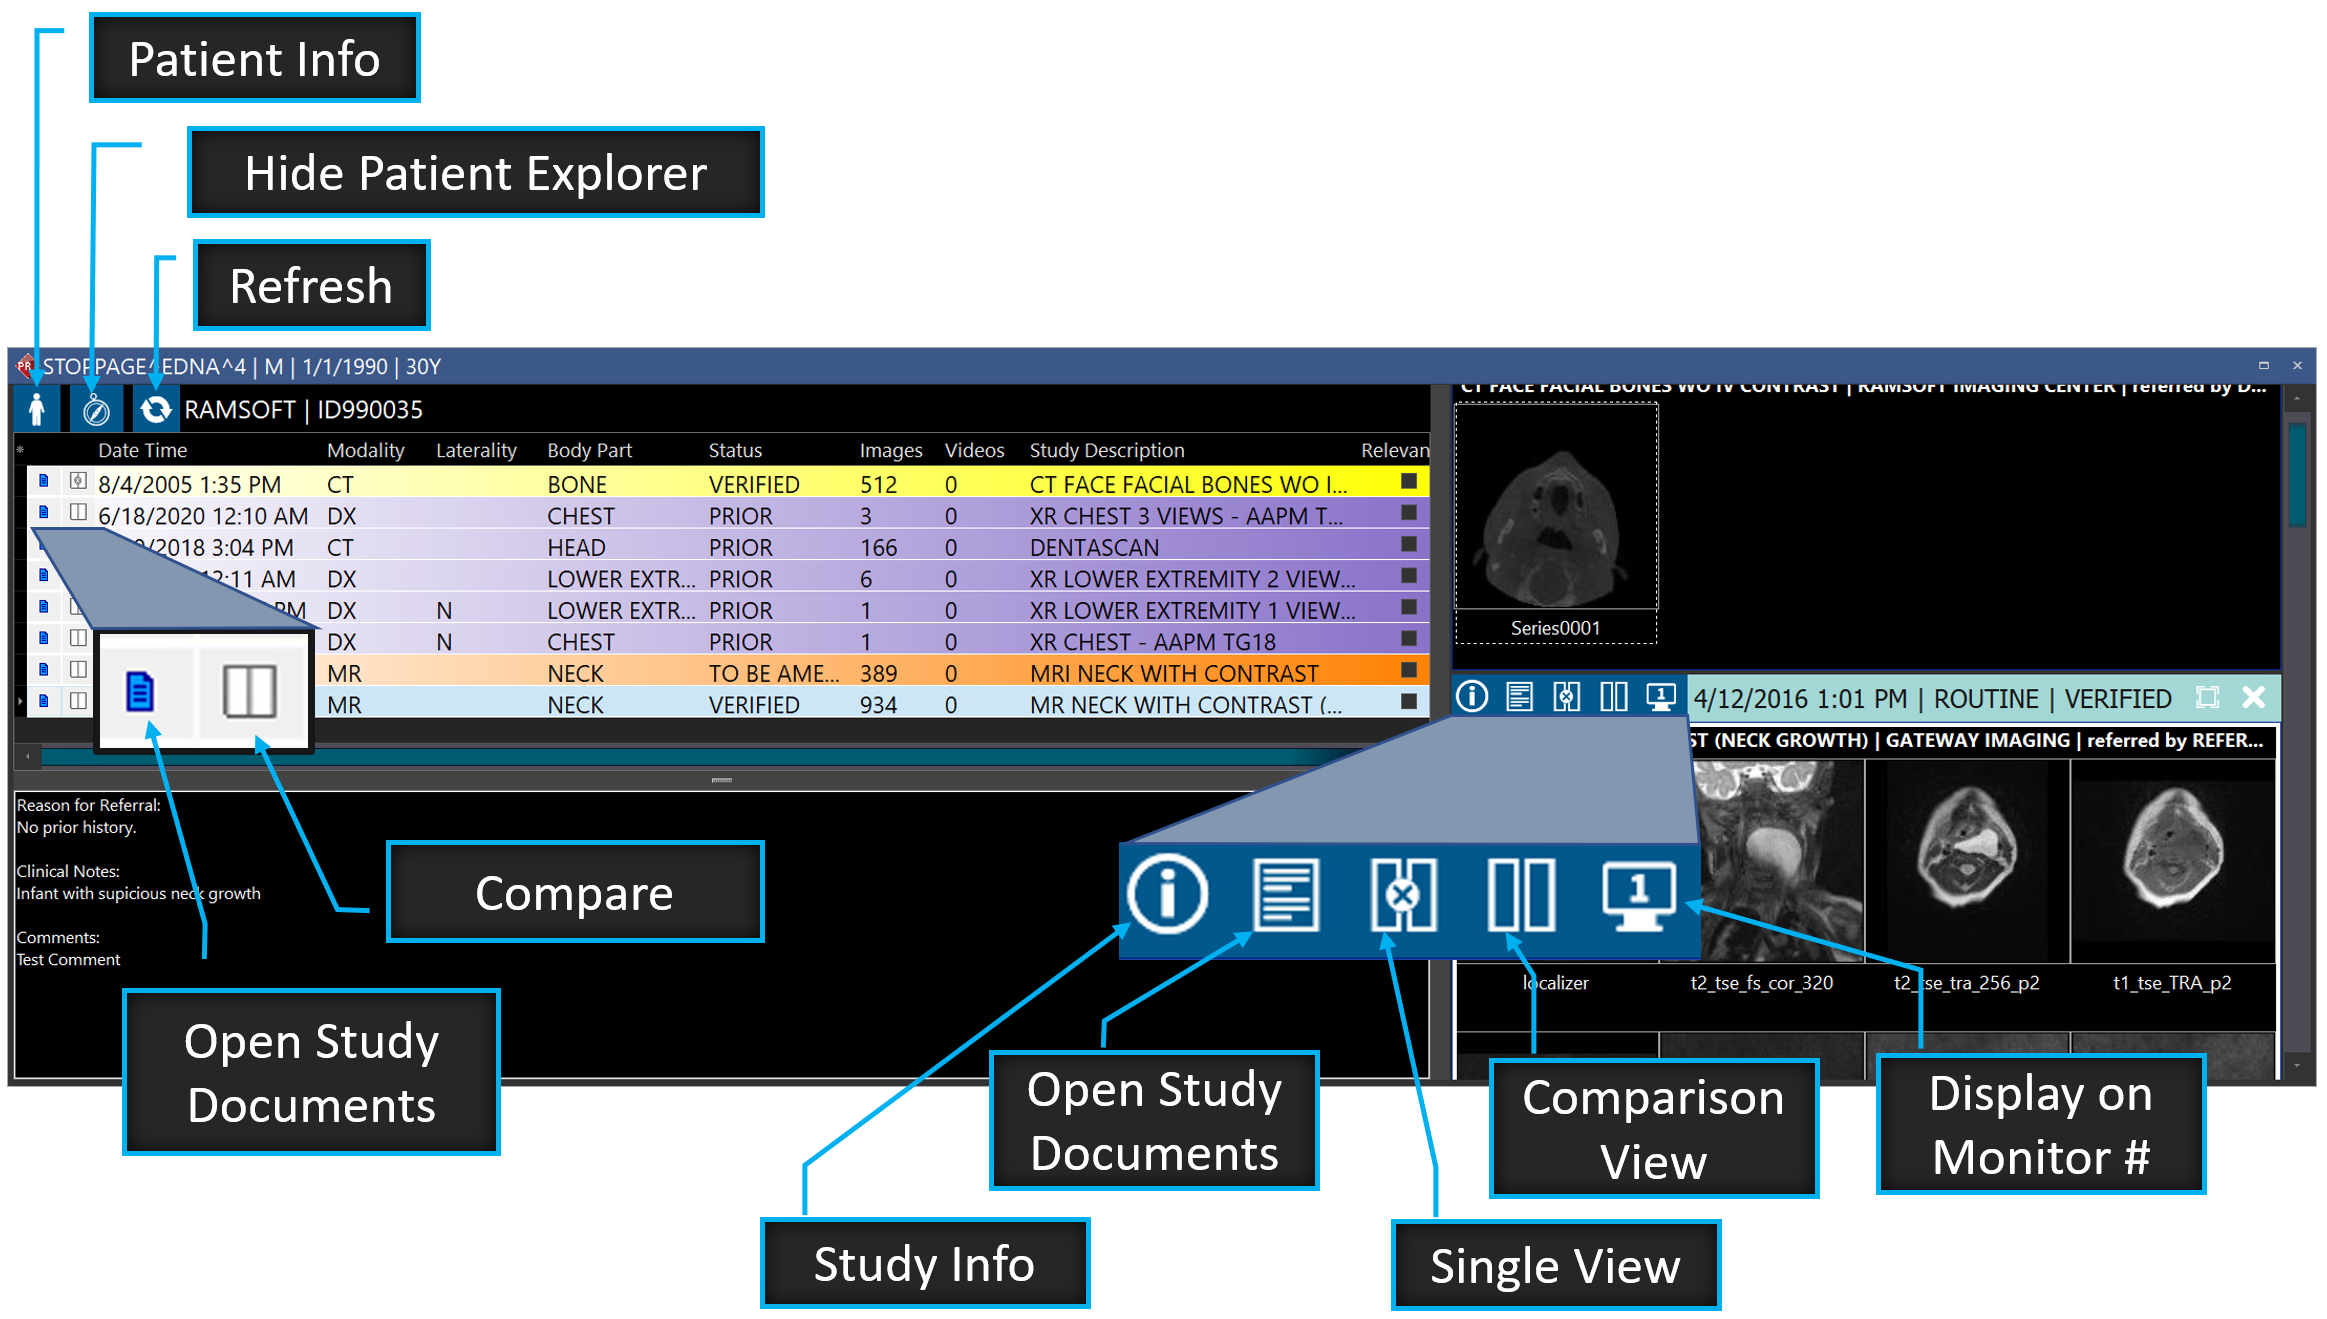
The Patient Explorer StudyGrid
The Patient Explorer StudyGrid displays the Modality, Laterality, Body Part, Status, and Study Description. In addition, all of the images within the series are shown as thumbnails within the Patient Explorer.
You can view the patient information and other demographic details by clicking the Patient Info ![]() tool button on the top left corner of the StudyGrid area. This helps you access patient information without having to navigate out of the study desktop.
tool button on the top left corner of the StudyGrid area. This helps you access patient information without having to navigate out of the study desktop.
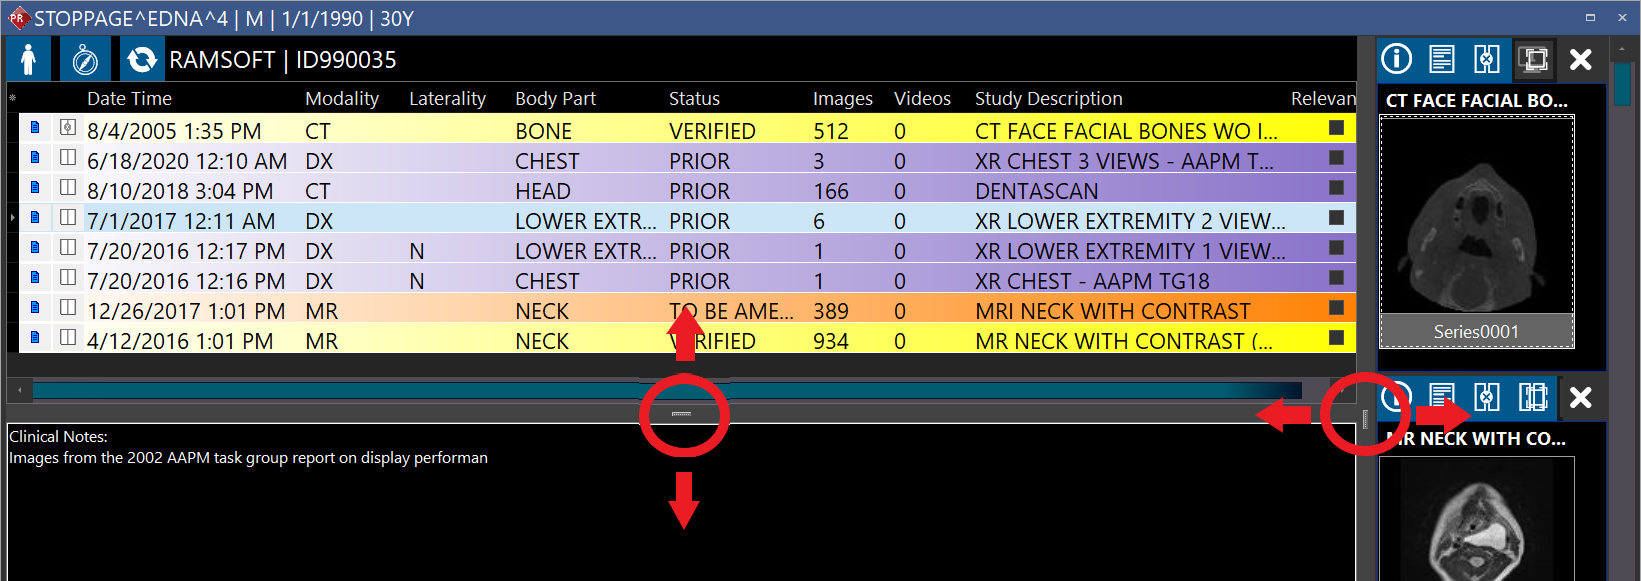
The StudyGrid has the Patient Name and Patient ID displayed on the top.
Based on the privileges assigned to you, you can also group studies listed in the StudyGrid. When you double-click on a particular record in the StudyGrid, you can see that the thumbnail series belonging to that record gets highlighted.
Note that you can extend the StudyGrid by dragging the splitter along horizontally view the entire grid along with its column headings. and also by dragging the bottom splitter of the StudyGrid vertically, you can view any relevant clinical notes/history for a particular study. When you exit PowerReader and login again, you can see that the splitters are in the same position as they were on your previous login.
If you hover the cursor over any of the column headings, you can see that there is a filter icon that is visible. In the event that you have a long list of studies and you want to narrow it down to few studies, you can use the filter feature to focus on the studies you wish to work on.
![]()
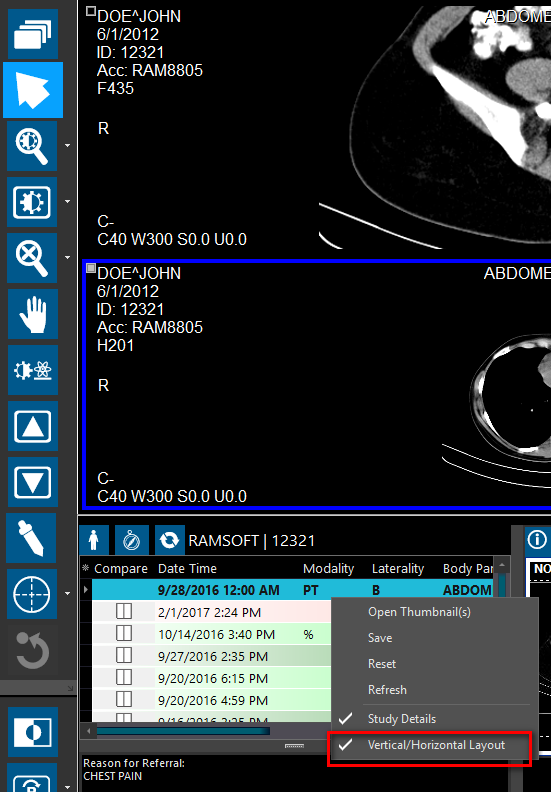
Patient Explorer Orientation
By default, the orientation/layout is set to Vertical. You can change the layout to Horizontal by un-checking the Vertical/Horizontal layout toggle option when you right-click on the study grid.
Patient Explorer Series Thumbnails Window
The Patient Explorer Thumbnails window has the following tool buttons:
| Toolbar Button | DESCRIPTION |
|---|---|
| Opens the Study Info form. For more information on Study Info form, refer to the topic Study Info. | |
| Opens the study documents for that comparison study in RapidResults. It is displayed as a floating window that could be resized/moved. | |
| Allows comparing two studies by simultaneous viewing of the studies. For more information on , refer to the topic Comparing Studies. | |
| Opens the study on a specific monitor. When you have two studies, a current and a prior study open and are being compared (either using the Auto-Compare option in the Viewing Protocol setup or by using the Compare toolbar button), the Monitor toolbar buttons on the Patient Explorer identify the monitors where the studies are being displayed by the physical monitor numbers. |
You can now display multiple thumbnails for all the studies without loading the actual images on the Image viewer. You can see that the thumbnails window loads all the thumbnail images for the listed studies along with any priors.
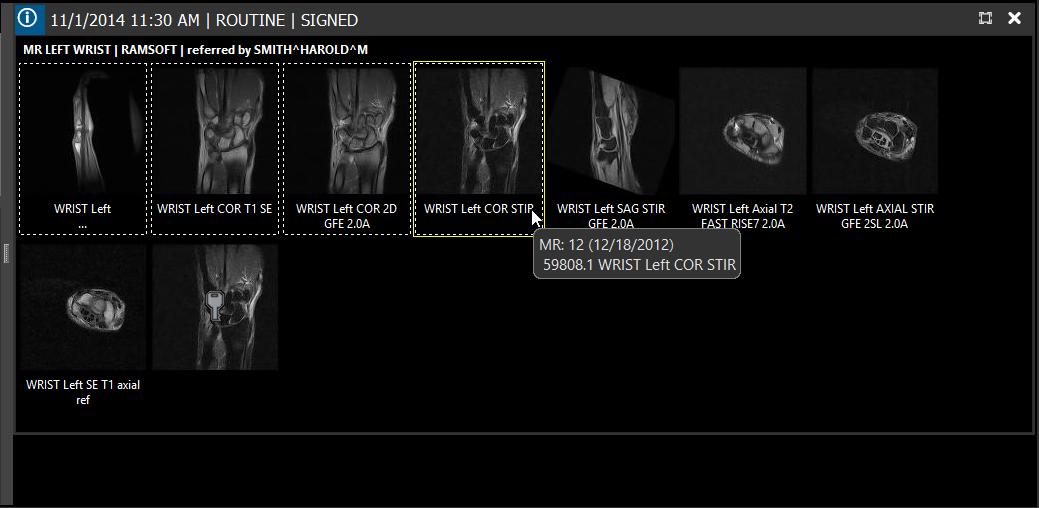
For all images except MG, when you enter a Series Description for a series in the Study Info window, the series description is displayed below the corresponding thumbnail in Patient Explorer. If you hover the mouse over a thumbnail frameset, you can see that a hint showing the entire series description along with frameset number is displayed.
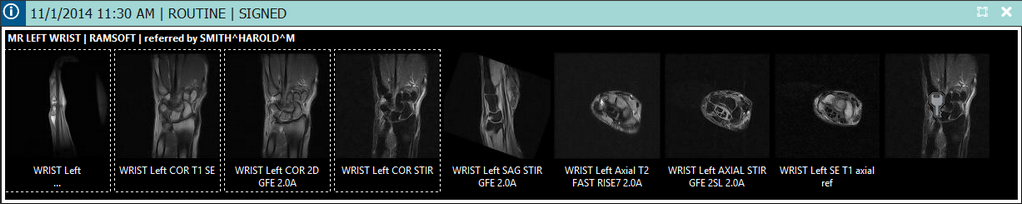
The series description displays two lines of text below the thumbnails instead of frameset numbers. In the event that the series description exceeds the amount of space available under the thumbnail, you can see that a "..."is appended at the end of the text that indicates that there is more information regarding the series description which is not visible.
For MG images, the image thumbnails display the Display View Code with a modifier followed by the Image Type 3 value below the thumbnail image. You can also see this information in the form of a hint when you hover the mouse over the thumbnail series.
In case of Key objects, if there is any description provided, it would be displayed under the Key Object Image Thumbnail. If a Key Object has no description, no description is displayed.
Double-clicking on any of the series in the thumbnail window will load that series into the current viewport.
Another way to control where series are displayed is by clicking on a series in the Patient Explorer and dragging it into the desired viewport to be displayed. The series that previously occupied that viewport will be swapped for the new series. This feature also works for images. Simply clicking and dragging an image from the Patient Explorer to a viewport will display that image.
When you right-click on any thumbnail image in the Patient Explorer, the following menu options are displayed:
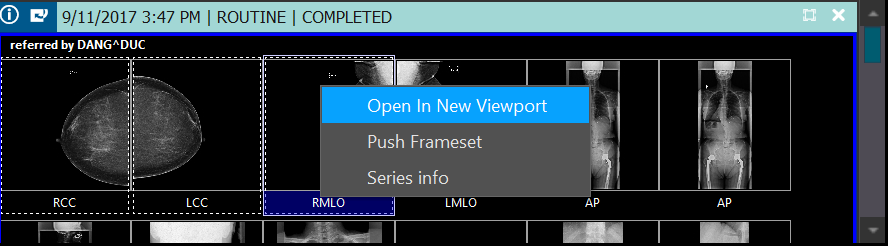
Choosing the Open in New Viewport option from that menu adds an additional viewport to the screen layout and open the selected series in the new viewport.
Push Frameset lets you push the selected frameset images. For more information on pushing images, refer to the topic How Do I DICOM Push Series or Images?
Series Info option lets you view the Series information.
The patient explorer series thumbnail window can be auto expanded to display all thumbnails; to view all thumbnail series, scroll down with the scrollbar to access them.
After scrolling down: