Configuring Color Mapping
The RamSoft software provides the capability of adding color to grayscale images in order to help identify pathology. This technique is especially useful for diagnosing metabolic activity hot spots in nuclear medicine (NM) and PT studies. The software provides a wide variety of mappings that can be used to translate grayscale to color. It also provides the capability of creating custom mappings and modifying existing ones. All these configuration details are performed through the Color Mapping dialog.
Click View > Edit Color Mapping. Color Mapping screen appears as shown below.
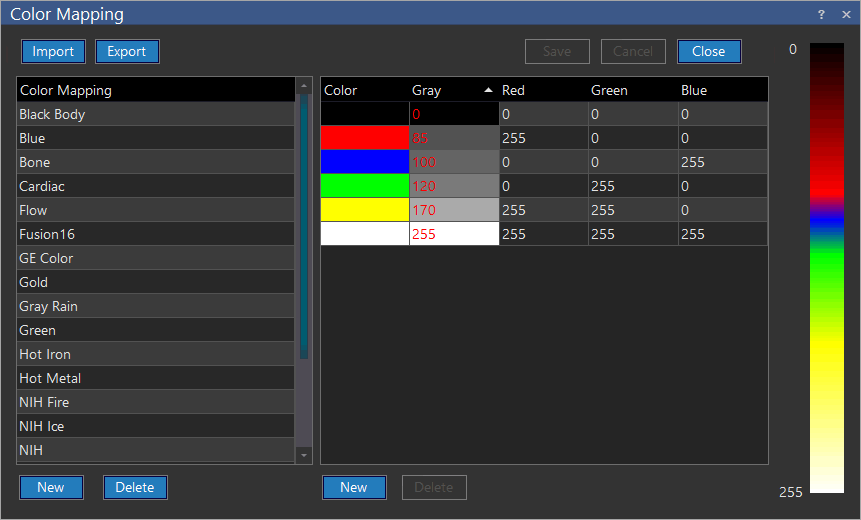
The Name dropdown menu contains all of the color mappings that exist in the system. Choosing any of them from the menu will display its details. The gradient bar on the right hand side shows the mapping that takes place between the 256 different grayscale values and the colors that are used. The table on the left hand side is where the mapping can be edited.
Every row in the table corresponds to one grayscale pixel. The Gray column contains the grayscale value of the pixel. The Red, Green and Blue values correspond to the intensities of the three prime colors that are applied when mapping that gray value. The Color column shows the color that is a result of the three colors mixed together based on the specified intensities. This column updates as the values are modified.
Changes are also visible in the gradient bar. If the user uses an existing name for a new color mapping by mistake, a message appears on the right side of the Name field. The user will not be able to save the duplicate name or leave the field blank.
 | The color mapping can be composed of up to 256 entries, one for every single pixel in the grayscale gradient. If there are less entries in the table, the system will automatically mix the two colors in the appropriate amounts to create a gradient between the two values. For example in the image above and to the side, grayscale value 0 is mapped to black, while the next defined pixel, 85, is mapped to a shade of red. The pixels 1 - 84 are evenly distributed mixture of the two colors resulting in the gradient visible in the top section of the gradient bar. The color mappings can also be exported into Comma Separated Value (CSV) files. These are files that can be opened by Microsoft Excel. Similarly existing mappings in CSV format can be imported. This is performed using the Import and Export buttons. To delete an entire color mapping, select it from the drop-down menu and click Delete. To add, click New. This will create a new table. You will need to name it by typing the name into the drop-down menu, and then manually enter the mapping values. |